Graph theory 101

Introduction
At its core, a graph is made of two components: vertices (also known as nodes) and edges (also known as arcs). Vertices represent entities while edges depict the connections between these entities. In a social network, vertices represent individuals and edges model the connections between them.
Graphs come in all shapes and forms, so much so that it requires some kind of categorization. This post introduces simple characteristics to describe graphs, namely direction, weight, cycles, connectivity and density.
Undirected and directed graphs

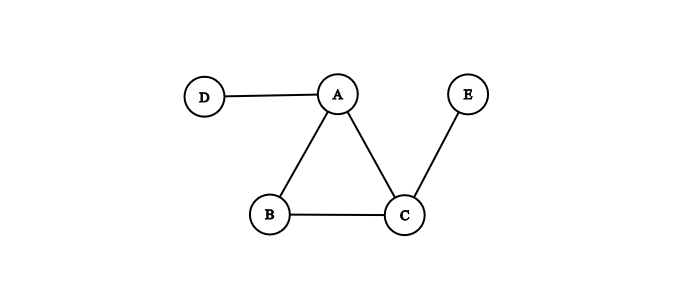
In an undirected graph, nodes are linked together but edges do not have a direction. If node A is linked to node B, then node B is also linked to node A. Edges are symmetric, they model two-way relationships and can be traversed in either direction. In other words: \( edge(A, B) = edge(B, A) \).
Examples of undirected graphs include connections in a social network and molecular structures. In a social network, if Alice is connected to Bob then Bob is in effect connected to Alice. In molecular structures, we can model atoms as nodes and bonds as edges.
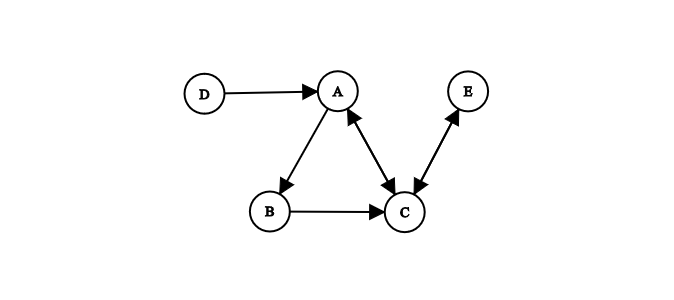
In a directed graph (sometimes called a digraph), edges indicate a one-way relationship. Each edge has a specific direction. In other words: \( edge(A, B) \neq edge(B, A) \).
Some edges in a directed graph can be bi-directional. In Figure 2 for instance, the edge between nodes A and C is bi-directional. A directed graph where all edges are bi-directional becomes an undirected graph.
Examples of directed graphs include followers in a social network, city maps and corporate holdings. In a social network like Instagram, if Alice follows Bob, it does not mean that Bob follows Alice. In a city, some streets can be only one-way. Regarding corporate holdings, if company A owns company B, it does not mean that company B owns company A.
Unweighted and weighted graphs
Unweighted graphs define connections but do not quantity these links. By convention, the weight of every edge in an unweighted graph is considered to be one. A weight of zero means no edge.
Typical examples of unweighted graphs include connections in a social network and hyperlinks between web pages. In a social network, connections between users simply exist or don't exist, but they all have the same importance. Similarly, web pages are either linked or not linked, but each hyperlink is of similar importance (the number of links pointing to a web page, on the other hand, has value - it is the pillar of Google's original PageRank algorithm).
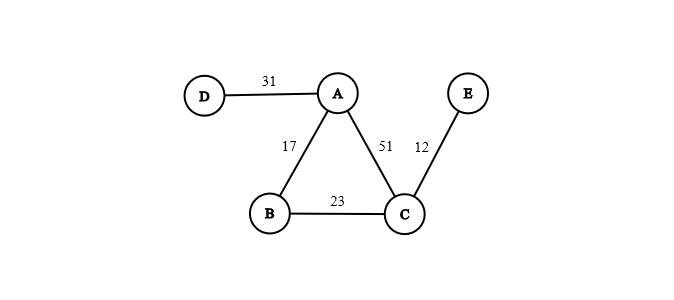
In a weighted graph, each edge is given a numerical weight. This weight can represent a cost, a distance, a duration etc. Note that in a directed graph, the edge pointing from A to B can have a different value than the edge pointing from B to A.
We can model distances between cities or conversions between units as weighted graphs. The first example is useful to compute the classic traveling salesman problem. In the second example, each unit is a node and the conversion factors (if they exist) are modeled as directed weighted edges.
Connecting the dots
As you have probably understood by now, direction and weight are not mutually exclusive properties. For example, Figure 1 is both undirected and unweighted whereas Figure 3 is undirected but weighted.
Let's summarize the four categories of graphs seen so far into a simple matrix. For each category, we give a real-life example expressed in the form edges between nodes:
| Weighted | Unweighted | |
|---|---|---|
| Directed | Conversions between units | Hyperlinks between web pages |
| Undirected | Distances between cities | Connections between individuals |
Cyclic and acyclic graphs

A cycle is a non-empty path in which the first and the last vertices are equal. A graph containing at least one cycle is called cyclic.
Transportation networks and social networks usually exhibit cyclic properties. In a transportation network, trucks can move goods from A to B, then from B to C and back from C to A. In a social network, it can emerge that Alice follows Bob, Bob follows Carol and Carol follows Alice.
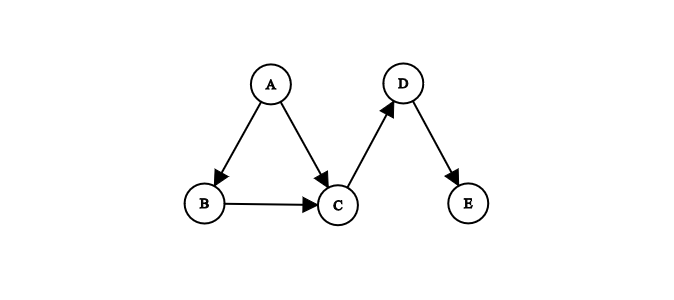
An acyclic graph does not have any cycle. When visiting the graph from node to node, one will never visit the same node twice.
In AirFlow, collections of tasks are defined as Directed Acyclic Graphs (or DAGs). It simply means that the tasks are linked together by edges that have a direction but do not form cycles. This way, we can specify an order of execution and avoid the formation of infinite loops.
Connected and disconnected graphs
We define a path as a sequence of edges. In a connected graph, there is a path between each node of the graph. For instance, the graph of a road network is usually connected since it's unlikely that a road sits by itself away from all other roads.
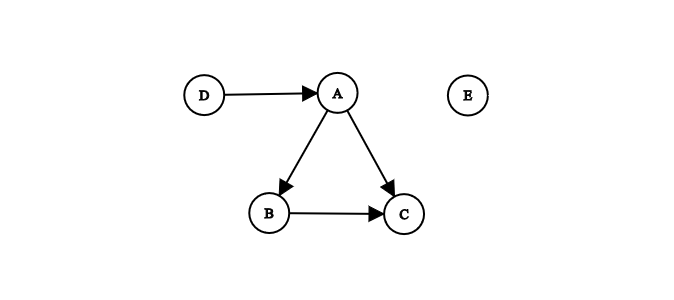
In a disconnected graph: all nodes are not necessarily linked by a path. For example, constellations or archipelagos can be modeled using disconnected graphs.
Graph density
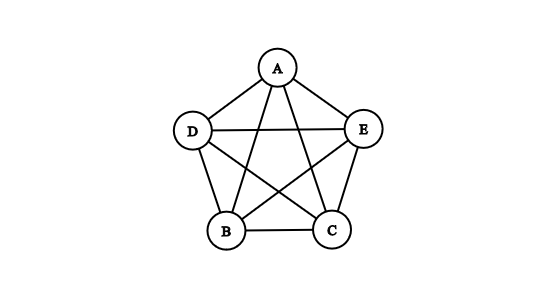
The maximal number of edges in an undirected graph of \( n \) nodes is \( n * (n-1) / 2 \). Logically, in a directed graph, it is \( n * (n-1) \) edges.
We can therefore describe graphs by their density:
| name | definition | density |
|---|---|---|
| null graph | edgeless disconnected graph | 0 |
| sparse graph | number of edges close to the minimum | \( \gtrsim 0 \) |
| dense graph | number of edges close to the maximum | \( \lesssim 1 \) |
| complete graph | each vertex has an edge to every other vertex | 1 |
Trees
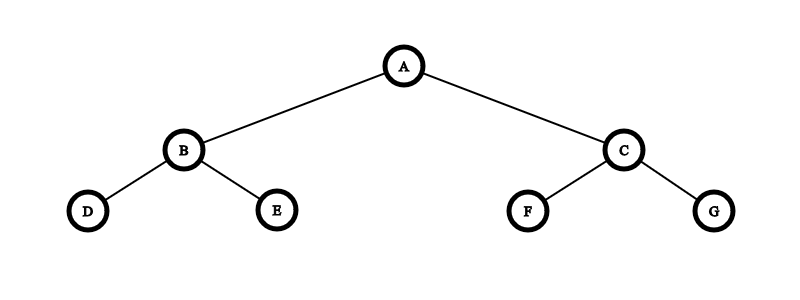
A tree is a connected acyclic graph.
In a tree, edges are named branches and nodes without children are called leaf nodes. In computer science, trees are also defined by the existence of a root (i.e. a starting node) and are usually assumed to be directed. For instance, in Figure 6, node A is the root and nodes D, E, F and G are leaf nodes.
A disconnected acyclic graph, i.e. a collection of trees, is called a forest.
An example of tree structure that you probably use everyday is the file system, where each directory is a node. The Document Object Model (DOM) is also a tree. Other examples of trees include family trees and decision trees.
Conclusion
In this article we have reviewed the basic properties used to describe a graph. By now you should be familiar with the notions of direction, weight, cycles, connectivity and density. These properties are not mutually exclusive: a graph can be directed, unweighted, acyclic and connected but sparse for instance.
Ordinary graphs can be generalized into more abstract structures such as multigraphs (where two nodes can be linked by more than one or two edges) and hypergraphs (where an edge is an area linking an arbitrary number of nodes).
In the next post we will look at how to model ordinary graphs using Python.
References: